Understanding Bitcoin Realized Loss: Insights from Glassnode
Bitcoin Realized Loss: Signs of Seller Fatigue?

Advertisement Banner
In a recent analysis shared on X, Glassnode has provided valuable insights into how the Bitcoin market has responded amidst recent price declines. The focal point of this analysis is the on-chain metric known as “Realized Loss.” This indicator calculates the total financial losses that Bitcoin investors are experiencing within the network.
How Realized Loss Works
The Realized Loss metric examines Bitcoin transactions to determine the price at which coins were previously transacted compared to their current market price. If a coin is sold at a price lower than its previous transaction price, it contributes to the Realized Loss. The difference between these prices reflects the actual loss incurred, and the metric aggregates these losses across the network to provide a comprehensive view.
Comparing with Realized Profit
Similar to Realized Loss, there exists a counterpart indicator called Realized Profit. This metric tracks transactions where the selling price exceeds the acquisition price, indicating gains rather than losses.
Analyzing Recent Trends in Bitcoin Realized Loss
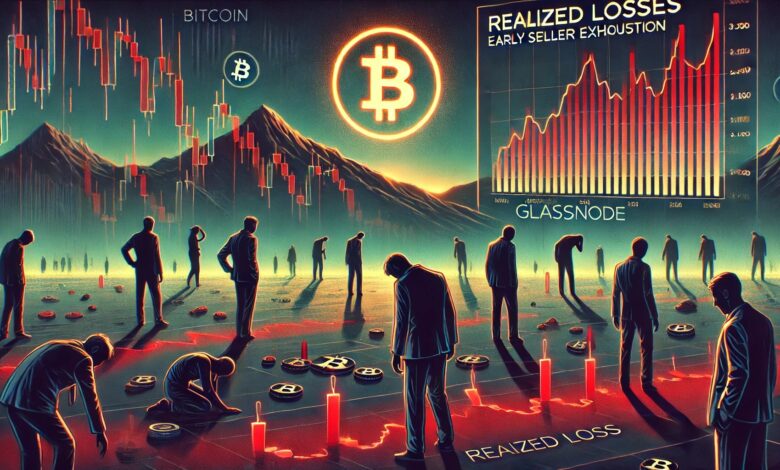
Glassnode’s recent chart depicts the 6-hour rolling value of Bitcoin Realized Loss over the past year. Observations indicate notable spikes during February and March, hinting at investor panic and significant coin sell-offs during these periods of bearish market behavior.
Current Market Dynamics
The recent concerns regarding tariffs have further exacerbated the asset’s drawdown. However, the current 6-hour Realized Loss spikes are smaller than those witnessed earlier, suggesting that sellers might be reaching a saturation point. This could be an early indicator that seller exhaustion is setting in, potentially hinting at a market bottom for Bitcoin, according to Glassnode.
Altcoin Market Cap Trends
In the same report, Glassnode delves into the trajectory of the altcoin market cap, which encompasses cryptocurrencies other than Bitcoin, Ethereum, and stablecoins. The altcoin market cap once peaked at $1 trillion in December 2024, but has since contracted to $583 billion. The firm attributes this to heightened sensitivity to liquidity shocks, causing significant sector-wide devaluation.
Bitcoin Price Movements
Bitcoin has shown signs of recovery over recent days, with its price rebounding to approximately $81,900. This upward trend offers a glimmer of hope for investors anticipating a sustained recovery.
Commitment to Quality Editorial Standards
Our Editorial Process at bitcoinist prioritizes meticulously researched, accurate, and unbiased content. We adhere to high sourcing standards, and every article undergoes thorough scrutiny by a team of technology experts and experienced editors. This rigorous process ensures our content remains trustworthy, relevant, and valuable for our readers.


