Understanding Bitcoin’s Market Dynamics: A Structural Analysis
When it comes to grasping the current phase of Bitcoin’s market, it’s essential to focus not on the short-term price movements but on the fundamental structure. This involves examining where capital is concentrated, how that capital is financed, and whether new demand is entering the ecosystem. A recent report from CryptoQuant emphasizes these underlying mechanics, positioning Strategy as a key structural reference point.
Decoding Strategy’s Influence on Bitcoin’s Market Phase
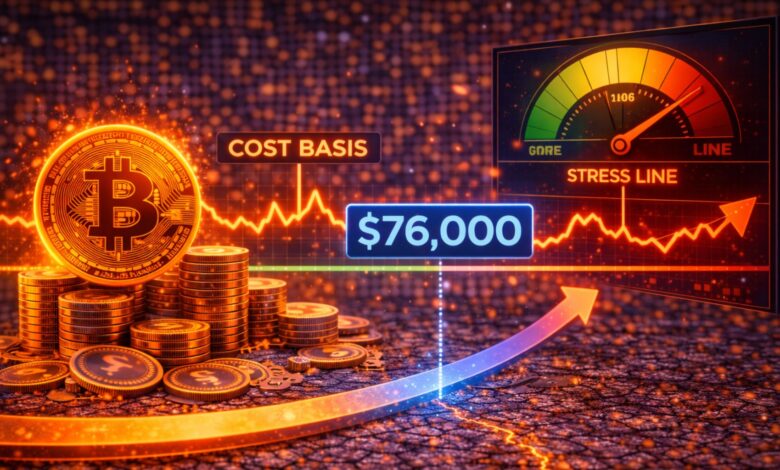
According to CryptoQuant analyst Maartunn, the average price of Bitcoin acquisitions by Strategy, approximately $76,000, has emerged as a significant market level. Although this level wasn’t deliberately set as a support, the substantial volume of Bitcoin accumulated at this price makes it impossible to overlook. As the market gravitates around this zone, the central question is whether the market can absorb supply without exposing deeper vulnerabilities.

Advertisement Banner
This price level holds more significance beyond mere spot price action. Strategy’s accumulation has been financed through capital markets, such as equity issuance and convertible debt, linking Bitcoin’s market structure to broader liquidity conditions. If Bitcoin’s price weakens while funding conditions tighten, the sustainability of structural demand is called into question.
Exploring Structural Leverage and Strategy’s Test Zone
A CryptoQuant analyst highlights that leverage in this market cycle extends beyond derivatives and into capital markets. Although Strategy is not utilizing short-term trading leverage, its Bitcoin accumulation is financed through equity issuance and convertible bonds. This underscores the critical nature of keeping the capital-market window open. Should Bitcoin’s value and Strategy’s equity weaken while funding conditions tighten, the firm’s ability to sustain accumulation could diminish, impacting a key source of structural demand.
On-chain data paints a cautious picture. Bitcoin’s Realized Cap has struggled to expand despite considerable price fluctuations, suggesting that the market is experiencing a rotation among existing holders rather than welcoming substantial new inflows. In such an environment, price increases are more likely driven by short covering or temporary liquidity effects than by sustained spot demand.
The Bitcoin Spent Output Profit Ratio (SOPR) provides further insight. With SOPR frequently below 1, short-term holders continue to realize losses and exit positions. While this dynamic can fuel temporary relief rallies, historical trend reversals typically require SOPR to reclaim and hold above the 1.0 threshold.
Despite these constraints, accumulation hasn’t ceased entirely. On a notable instance, Michael Saylor announced that Strategy acquired 855 BTC for about $75.3 million at an average price of $87,974. As of February 1, 2026, Strategy holds 713,502 BTC, acquired at an average cost of $76,052, totaling roughly $54.26 billion.
Until spot volume, ETF inflows, and Realized Cap reaccelerate together, the prevailing scenario remains broad consolidation. The $76,000 level is not a guaranteed floor but a structural test, emphasizing that this market is defined by structure rather than price alone.
Bitcoin’s Structural Shift: Breaking Key Support Levels
Bitcoin’s recent price action indicates a significant shift in market structure towards a bearish trend. After multiple unsuccessful attempts to reclaim the declining short-term and medium-term moving averages, BTC has accelerated downward, breaching the $80,000 psychological level and testing the $78,000–$77,000 range.
This area now stands as the first significant demand region, but the method by which the price reached this level is noteworthy. The move was impulsive, with expanding red volume bars, indicating active distribution rather than passive consolidation.
Structurally, Bitcoin remains below its 50-day and 100-day moving averages, both sloping downward, reinforcing bearish momentum. The 200-day moving average, still trending higher near the low-$100,000s, is now significantly above the current price, emphasizing how extended the correction has become relative to the previous uptrend. Recent rallies have consistently stalled beneath falling resistance, forming a series of lower highs that define a clear downtrend.
As long as BTC remains below the former support turned resistance near $85,000–$88,000, the risk of further downside or prolonged consolidation remains high. The market seems focused on finding acceptance at lower levels rather than initiating a sustained recovery.
The Editorial Process: Ensuring Integrity and Accuracy
The editorial process for Bitcoinist is centered around delivering meticulously researched, accurate, and unbiased content. We adhere to strict sourcing standards, and each page undergoes a thorough review by our team of top technology experts and seasoned editors. This rigorous process ensures the integrity, relevance, and value of our content for our readers.


