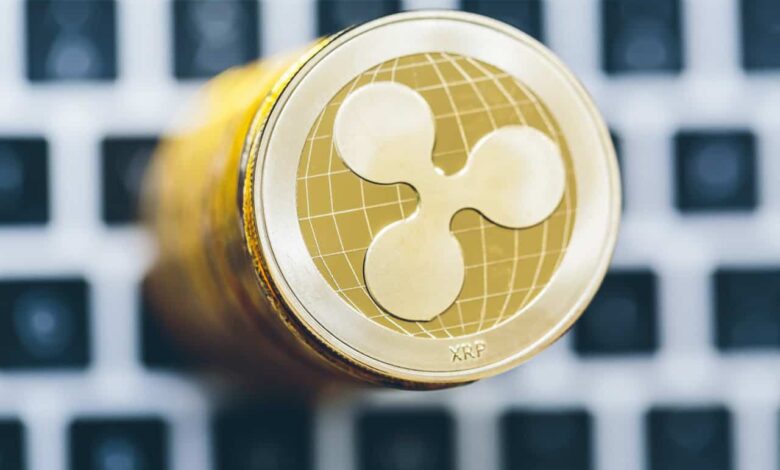
XRP’s Path to Reclaiming $3: An In-Depth Analysis
Cryptocurrency enthusiasts are eagerly watching XRP as it navigates its way back to the $3 resistance level, a milestone that has proved challenging in recent times. In this comprehensive analysis, we delve into the technical indicators and market dynamics that suggest XRP may face an extended wait before achieving this target.
Bearish Signals Emerge for XRP
Currently, XRP is exhibiting bearish tendencies, as indicated by the TD Sequential indicator. This tool has triggered a sell signal on the daily chart, pointing towards a potential price decline. Renowned cryptocurrency analyst Ali Martinez highlighted this development in a recent post, suggesting that a pullback could be imminent.
Understanding the TD Sequential Indicator
The TD Sequential ‘9’ sell signal is a pattern used to identify trend exhaustion and potential short-term reversals. In XRP’s case, this indicator warns of possible sustained volatility. If selling pressure intensifies, Martinez identifies crucial support levels at $2.50 and $2.35. However, should XRP maintain its current position and negate the TD Sequential signal, the next significant resistance points are at $2.80 and $3.
XRP’s Historical Price Movement
Despite recent downward pressure, XRP’s price movements align with broader cryptocurrency market trends. A glance at historical data reveals that XRP is replicating patterns reminiscent of its 2017 breakout. Cryptocurrency analyst Dark Defender notes that, despite recent struggles, XRP’s long-term bullish outlook remains intact.
Potential for a Parabolic Surge
Dark Defender emphasizes that XRP is following a trajectory similar to its 2017 surge. After surpassing two critical resistance trendlines, it’s now eyeing targets above $5. Recently, XRP breached the $0.8462 resistance, aligning with the 70.7% Fibonacci retracement. Key future targets include $3.8577 (2.618 Fibonacci) and $5.8554 (3.618 Fibonacci), suggesting the potential for a parabolic rise akin to 2017.
Trading experts like TradingShot echo this sentiment, predicting that XRP could reach $12.50 if the current trend continues.
Regulatory Developments and Their Impact
Beyond technical factors, regulatory developments play a crucial role in XRP’s price trajectory. With a more crypto-friendly administration, the XRP community is optimistic about resolving its ongoing legal battle with the Securities Exchange Commission (SEC). A favorable outcome, such as case dismissal or settlement, could significantly influence XRP’s valuation.
Additionally, attention has shifted to the SEC’s review of a spot XRP exchange-traded fund (ETF) after receiving applications in mid-February. A decision is anticipated by October 2025, further contributing to the uncertainty surrounding XRP’s price.
Current XRP Price Analysis
As of the latest update, XRP is trading at $2.58, reflecting a 3% decline over the past 24 hours but a 3.4% increase on a weekly basis. Despite the short-term bearish sentiment, with prices hovering below the 50-day simple moving average (SMA) of $2.66, long-term prospects remain positive. XRP’s current price comfortably sits above the 200-day SMA of $1.39.
Market Sentiment and Volatility
Momentum indicators like the Relative Strength Index (RSI) show neutrality, with a reading of 49, suggesting that XRP is neither overbought nor oversold. However, volatility remains elevated at 10.81%, indicating potential for price fluctuations in the near future.
In conclusion, XRP’s journey to reclaim the $3 resistance level is influenced by a complex interplay of technical indicators and regulatory factors. While short-term challenges persist, the long-term outlook remains promising for this dynamic cryptocurrency.


