XRP Market Struggles: A Deep Dive into Liquidity and Price Dynamics
In the realm of cryptocurrency, XRP has been facing significant challenges as it is unable to break past the $1.50 mark. This struggle is part of a broader trend affecting major altcoins, characterized by a slowdown in market activity. Recently, the lack of momentum in price movements has been evident, with any rebounds quickly dissipating. This is largely due to fragile liquidity conditions and a noticeable decline in investor engagement. While macroeconomic uncertainties and changing capital flows have impacted the crypto market at large, specific on-chain data point to XRP facing a structural decline in trading activity.
XRP Liquidity Challenges and Market Participation Decline
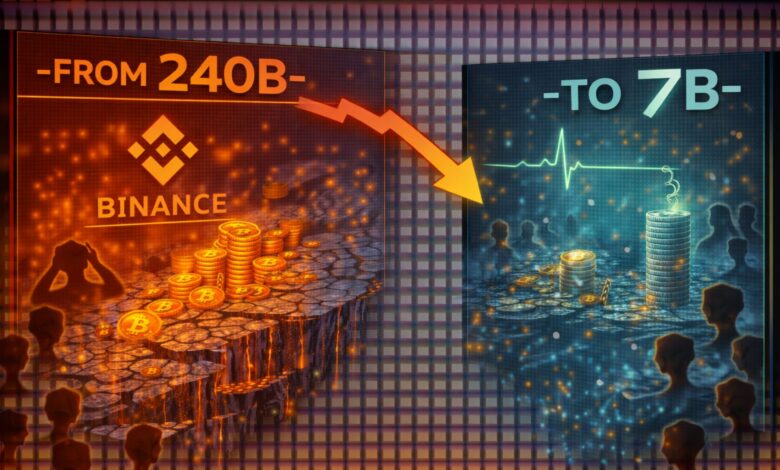
A recent report from CryptoQuant sheds light on this trend, focusing on the XRP Binance 30-Day Liquidity Index. This index is designed to assess activity levels on the platform relative to the circulating supply. By comparing the 30-day turnover rate with the total supply, it provides insights into how actively XRP is being traded within the exchange ecosystem. According to the latest figures, the turnover rate has reduced to about 7.02 billion XRP in the last month. Concurrently, the liquidity index has plummeted to approximately 0.097, a level that approaches historical lows relative to previous market peaks.

Advertisement Banner
This decline in both turnover and liquidity indicates a significant structural shift in market dynamics, suggesting a marked cooling in participation even as XRP attempts to stabilize around key support levels.
Historical Context: Evolution of Liquidity on Binance
The report further contextualizes XRP’s liquidity evolution on Binance, noting the robust expansion phase between 2022 and 2024. During this time, the 30-day liquidity index often exceeded a reading of 3, coinciding with a dramatic increase in turnover where monthly trading volumes reached between 180–240 billion XRP. This was a period marked by intense activity, with speculative participation and high transaction velocity enhancing liquidity across the platform.
However, in 2025, these conditions began to shift. As the year progressed, the turnover rate saw a significant decline, and the liquidity index fell below the neutral threshold of 1, eventually nearing its current near-zero readings. This contraction signifies a slowdown in trading activity relative to the XRP supply held on the exchange.
Implications of a Declining Liquidity Index
A declining liquidity index does not necessarily imply immediate downward pressure on price. Instead, it suggests a reduction in the velocity of supply within the platform. When fewer coins circulate actively in trading flows, the market can experience periods of reduced participation and lower turnover. However, low-liquidity environments often make price movements more sensitive to sudden capital shifts. In such scenarios, a resurgence in turnover could quickly alter XRP’s short-term price dynamics.
Price Movements and Key Resistance Levels
On a 3-day chart, XRP is currently in a corrective phase following a sharp rejection from the $3.30–$3.50 range during the last cycle peak. The chart reveals a persistent pattern of lower highs and lower lows, indicating a decisive shift in momentum to the downside since mid-2025.
Currently trading near $1.41, XRP is positioned below the 50-period (blue) and 100-period (green) moving averages, both trending downward. This alignment reflects ongoing bearish pressure and indicates weak medium-term momentum. The 200-period moving average (red), now around the $1.90–$2.00 zone, has transitioned into a significant resistance level after previously serving as structural support during the earlier stages of the uptrend.
Key Support and Resistance Levels
In early February, a sharp liquidation wick briefly pushed the price toward the $1.10 area before buyers intervened, resulting in a reactive rebound. However, subsequent price actions have lacked follow-through, suggesting the recovery is corrective rather than the onset of a new bullish trend. Structurally, the $1.30–$1.35 region now serves as immediate support. A breakdown below this zone could lead XRP to further downside toward the psychological $1.00 level. Conversely, reclaiming the $1.80–$2.00 range would be essential to challenge the broader bearish trend.
Commitment to Quality: Editorial Standards
Editorial Process at Bitcoinist emphasizes delivering thoroughly researched, accurate, and unbiased content. We adhere to strict sourcing standards, and each article undergoes rigorous review by our team of top technology experts and seasoned editors. This process ensures the integrity, relevance, and value of our content for our readers.


