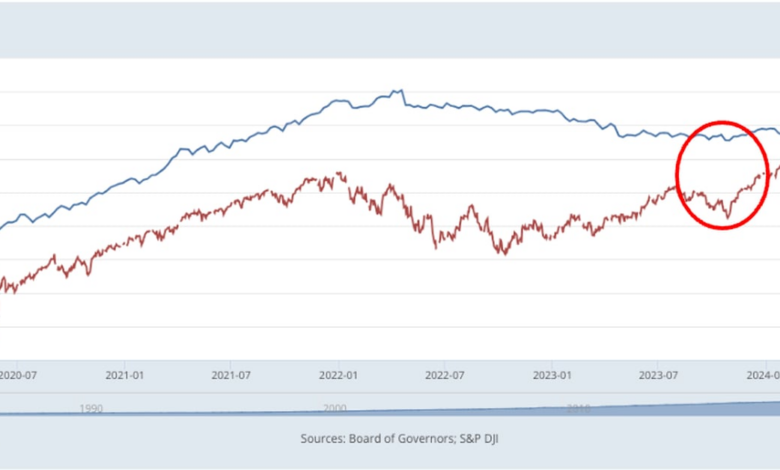
When looking at the historical data, it becomes clear that there is a significant correlation between the movements of the S&P 500 and the M2 money supply. This correlation has been observed over the past five years, with both indicators moving in tandem.
For instance, during the early months of the COVID-19 pandemic in 2020, the M2 money supply reached a low of $15.2 trillion in February. This was followed by the S&P 500 hitting a low of around 2,409 points in March. A similar trend was seen in October 2023, when monetary policy tightening caused the M2 money supply to bottom out at $21 trillion. Shortly after, the S&P 500 also reached a low point of 4,117.
This pattern underscores the crucial role that liquidity plays in driving the performance of the stock market. As the M2 money supply fluctuates, it can have a direct impact on the movements of the S&P 500, highlighting the interconnected nature of these two key indicators.


