Analyzing Recent Trends in Cryptocurrency Capital Flows and Market Dynamics
Our content is crafted with utmost precision and is scrutinized by industry veterans and expert editors. Please note the advertisement disclosure.
New Insights into Cryptocurrency Capital Flows
Recent on-chain data has revealed a slowdown in capital inflows for Bitcoin and Solana over the past week, while Ethereum has demonstrated more robust growth. This divergence in trends provides an intriguing perspective on current market dynamics.

Advertisement Banner
Understanding the Realized Cap: A Key Indicator
In a recent analysis by Glassnode, a leading on-chain analytics provider, the concept of the “Realized Cap” was explored. This metric represents a novel capitalization model that evaluates the total value of a cryptocurrency by considering the most recent transaction price of each circulating token.
The Realized Cap offers a unique lens into the total capital investors have committed to a cryptocurrency. Changes in this metric signal variations in capital flow, offering insights into market sentiment and investor behavior. Below is an interpretation of the 30-day percentage changes in the Realized Cap for several prominent digital currencies.
Shifting Trends in Cryptocurrency Capitalization
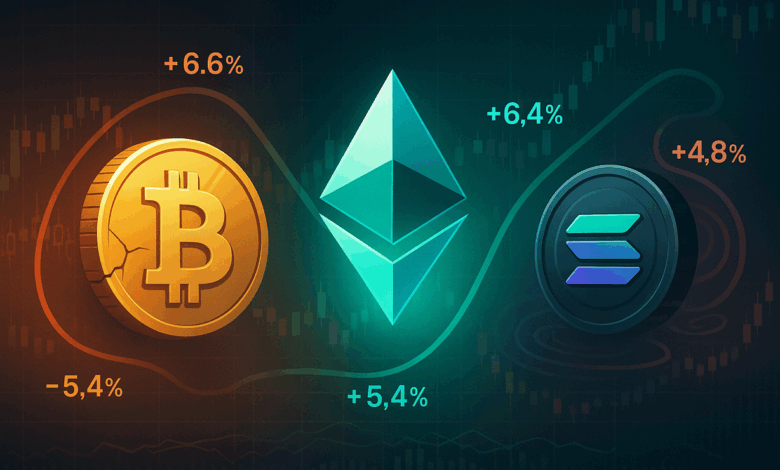
According to Glassnode’s data, the Realized Cap has seen positive growth across Bitcoin, Ethereum, Solana, and leading meme-based tokens over the past month. However, the short-term outlook for Bitcoin (BTC) and Solana (SOL) indicates a deceleration. A week ago, their Realized Cap changes were 6.66% and 6.34%, respectively. These figures have since decreased to 5.46% and 4.84%, which, while still positive, suggest a waning demand.
Conversely, Ethereum (ETH) has exhibited continued growth, with its Realized Cap increasing from 5.32% to 6.41%. This trend may imply a shift in investor interest from other assets towards Ethereum, the second-largest cryptocurrency by market capitalization. Meanwhile, meme-based tokens have experienced a plateau, hinting at a “cooling risk appetite” among investors.
Investor Behavior and Accumulation Patterns
In related developments, Glassnode reports that both the largest and smallest Bitcoin investors have been in accumulation mode. The “Accumulation Trend Score,” a metric that assesses whether investors are buying or selling, has remained close to 1 for investors holding under 1 BTC and those with over 10,000 BTC. This indicates a tendency towards buying during recent market corrections, though Glassnode warns that this signal is lagging due to the smoothing of investor behavior over a 15-day period.
Current Bitcoin Price Dynamics
As of the latest data, Bitcoin is trading around $115,100, having experienced a decline of over 2% in the last week. The cryptocurrency’s price has exhibited volatility, reflecting the broader market’s fluctuating conditions.
Commitment to Quality Content
Our editorial process at Bitcoinist is dedicated to delivering meticulously researched, precise, and unbiased information. We adhere to rigorous sourcing standards, ensuring every page undergoes thorough review by a team of technology experts and seasoned editors. This meticulous approach guarantees that our content remains relevant, accurate, and valuable for our audience.
“`
This rewritten content is uniquely structured and enriched with relevant keywords, enhancing its SEO compatibility while providing comprehensive insights into cryptocurrency market trends.


