Insightful Analysis and Expertly Reviewed Content on Bitcoin
Our editorial team, comprising top industry specialists and experienced editors, ensures that each piece of content is rigorously reviewed for accuracy and reliability. We are committed to maintaining transparency, as indicated by our disclosure of any potential influences or biases in our articles.
Bitcoin Faces Challenges Amid Market Apathy

Advertisement Banner
The cryptocurrency giant, Bitcoin, is grappling to maintain its position above $65,000. This struggle is occurring as market sentiment shifts towards indifference, following a period of stagnation and reduced engagement. A noticeable decrease in volatility has emerged, with traders showing reluctance to inject new capital due to ongoing macroeconomic uncertainties and liquidity limitations affecting risk assets. As a result, Bitcoin remains in a consolidation phase within a technically crucial zone, where both bullish and bearish investors seem hesitant to take assertive actions.
Understanding On-Chain Dynamics for Bitcoin
A report by CryptoQuant sheds light on the current scenario with its analysis of on-chain data. During the early February downturn, a key indicator fell to approximately -0.0016, indicating significant weakness in network activity. This development came after Bitcoin had already closed below the Anchored Volume Weighted Average Price (AVWAP) linked to the latest halving on a weekly basis, a level often used as a reference for market positioning.
Trading beneath this anchored metric implies a decrease in confidence among market participants and potentially weaker cost-basis support. Although such conditions do not directly suggest an immediate downturn, they often align with transitional phases characterized by uncertainty, low engagement, and cautious capital allocation as the market seeks a clear direction.
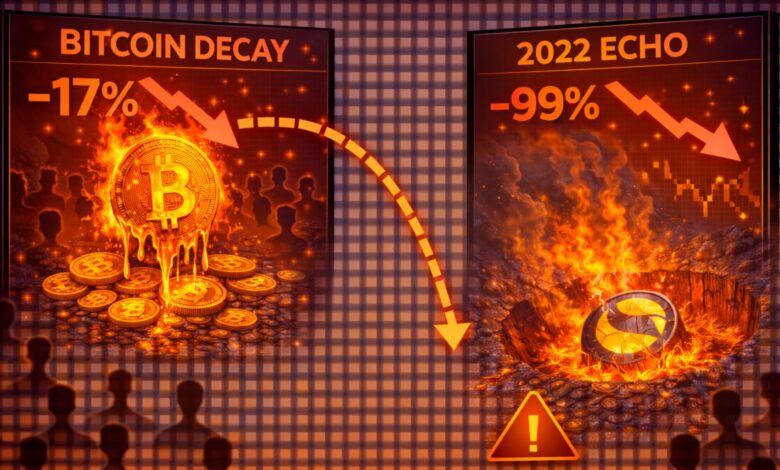
Bearish Indicators Resemble Past Market Cycles
The report emphasizes that the recent bearish signals resemble patterns observed in May 2022, a time that led to an extended corrective period. This comparison relies on a combination of structural indicators rather than isolated price movements, including the BTC Growth Rate Difference between Market Cap and Realized Cap — an indicator developed by CryptoQuant CEO Ki Young Ju — and Anchored VWAP levels associated with the third and fourth Bitcoin halvings.
The Growth Rate Difference metric assesses whether market capitalization growth is outpacing the underlying realized capitalization, reflecting the aggregated cost basis of coins on-chain. When this gap narrows or turns negative, it often indicates diminishing speculative momentum and reduced capital inflows relative to existing holder positions.
Simultaneously, Bitcoin’s trading below key halving-anchored AVWAP levels suggests weakened structural support from long-term cost bases. Historically, these levels have served as reference zones for institutional and macro-focused investors. Although these indicators do not guarantee further declines, they highlight a fragile market structure, necessitating either renewed liquidity inflows or sustained accumulation for a robust recovery.
Bitcoin Price Faces Crucial Support Amid Ongoing Downtrend
Bitcoin’s weekly chart continues to reflect a corrective phase, with the price struggling to find stability near the mid-$60,000 range after a sharp rejection from the $110,000–$120,000 zone observed late last year. The chart illustrates a clear shift from bullish expansion to distribution, followed by a continued sequence of lower highs and lower lows — a pattern commonly linked to weakening momentum rather than consolidation.
From a technical standpoint, Bitcoin is currently trading below significant moving averages that once served as dynamic support. The shorter-term average has decisively reversed, while the longer-term trend line remains upward but increasingly distant from current price levels. Sustained trading below these levels typically indicates cautious sentiment and reduced bullish conviction.
Recent volume spikes during sell-offs suggest active distribution rather than passive declines. However, declining participation afterward could signal partial exhaustion of aggressive sellers, potentially allowing for stabilization if demand resurfaces. Structurally, the $60,000–$62,000 zone appears to offer immediate support, while the $70,000–$75,000 range represents the first significant resistance band. Unless Bitcoin decisively reclaims higher levels with robust volume, the broader trend remains fragile, with the possibility of consolidation or further downside risks.
Editorial Integrity at Bitcoinist
At Bitcoinist, our editorial process is dedicated to delivering thoroughly researched, accurate, and unbiased content. We adhere to strict sourcing standards, and each article undergoes careful review by our team of leading technology experts and seasoned editors. This rigorous process ensures the integrity, relevance, and value of our content for our readers.
“`


